
365 DAYS OF PATTERN RECOGNITION TO IMPROVE PERFORMANCE AND
UNDERSTAND HOW WE ARE WIRED
HOW DID IT START?
CAN PATTERN RECOGNITION INFLUENCE OUR DECISIONS AND IMPROVE OUR PERFORMANCE?
The idea of an observational study showed up while I was learning about diverse models of pattern recognition in a variety of domains: psychology, music, art, advertising, business and more.
(Great books with particularities on the subject are written by the following authors: Derek Thompson, Malcolm Gladwell, Ray Dalio, Jordan Peterson, Joshua Foer, Daniel Pink, Allain de Botton & more others).
My main curiosity when I decided to start this project was to learn more about pattern recognition and get a deeper understanding on how it impacts our decisions and improve our daily discipline towards achieving what we want.
Therefore, for one year I filled in a daily agenda that monitored 4 important variables of my life: daily activities, social connections, physical exercise and the content I consumed or the events I joined for self-development.
Another important factor marked in the observation agenda was the affective value attached to each of the activities I participated in or the social connections I made. More explanations on the subject will be find in the presentation below.
WHAT YOU WILL LEARN FROM HERE?
PART I: About the study
- The OBJECTIVE.
- The TEMPLATE.
- The END-GOAL.
PART 2: Template Presentation
- The OBSERVATION PERIOD for data collecting.
- The monitored VARIABLES/ CATEGORIES.
- The COLOR PATTERN: What is it and what is its role?
- The COLOS: Understanding them and their LINKS with the CATEGORIES
PART 3: Data Analysis
- Presenting the ORIGINAL TEMPLATE with the data
- Value Criteria and DATA INTERPRETATION
- CONCLUSIONS and personal thoughts.
PART I: About the study
1. THE OBJECTIVE.
The objective was to SETUP A TEMPLATE that would expose a persons’ daily activities and spot the ways these are influencing the subject’s mood & growth on a short to a long-term period.
2. THE TEMPLATE.
The template’s purpose is to facilitate a visual pattern that would make connections-linking between its parts very easy.
3. THE END GOAL.
The end-goal was to design a universal tool that would help anyone to:
A) IMPROVE SELF-AWARENESS:
- Get a deeper understanding of the cause-effect relationship related to your daily activities.
- Spot your strengths and weaknesses using the color-pattern (*Color pattern will be explained later, below).
- Understand what works for you and what doesn’t in any area of your life, using the color pattern.
B) SPOT OPPORTUNITIES:
- Spot opportunities on building meaningful relationships, accelerating business development and exploring new skills or unknown territories when it comes to self-discovery.
C) IMPROVE PERFORMANCE THROUGH BETTER AND FASTER DECISIONS
- Learn to spot activities and events that bring very little value in terms of learnings, well-being or social connections in order to start redirecting that energy to something else.
D) DEVELOP CUSTOM COPING-MECANISMS TO CHALLENGING SITUATIONS
- Understanding the links between your strengths, weaknesses and the opportunities you encounter every day is important in order to design a variety of mechanisms. Later, they will help you overcome future difficulties in an easier way or anticipate priceless occasions.
PART II: Template Presentation
1. THE OBSERVATION PERIOD FOR DATA COLLECTING
The study covered one year of observation.
For easier data processing, the information collected was separeted in 12 tables of 30-31 days, each of them summarizing one of the 12 months of the year.
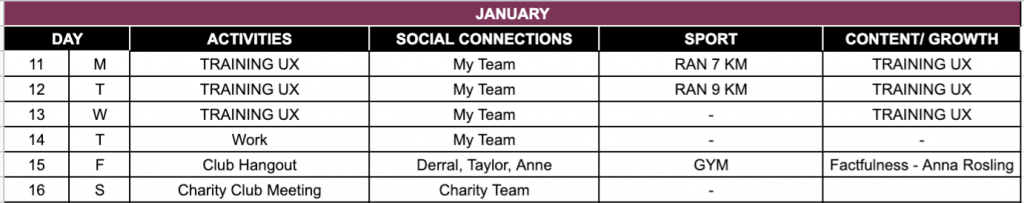
1. Example: A standard month template.
*The example template doesn’t have the color pattern applied, since it will be explained later in CHAPTER 2 & 3, along with the variables/categories.
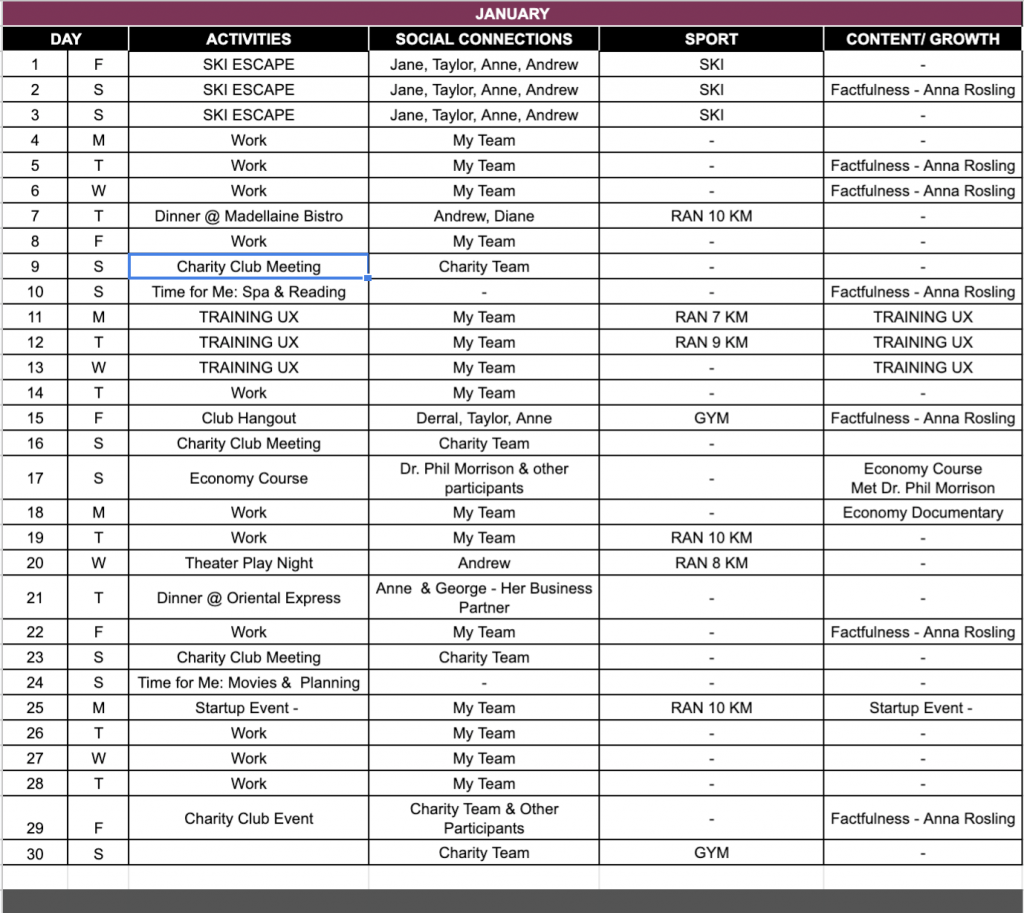
The original 365 days template of the study is presented in PART III: Data Analysis.
2. THE MONITORED VARIABLES/CATEGORIES:
ACTIVITIES, SOCIAL CONNECTIONS, SPORT & CONTENT/GROWTH EXPERIENCES
![]()
The choice to monitor these specific 4 categories was related to the main objective: to SETUP A TEMPLATE that would expose a person’s daily activities and spot the ways they influence their mood & growth on a medium-to-long-term period.
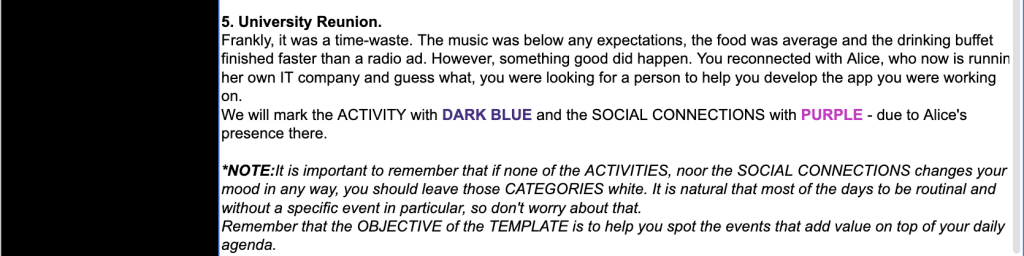
A) ACTIVITIES:
Everyone has 24 hours to spend in a day. What makes the differences in people’s lives is how they choose to spend this limited time: the activities that fill in their days.
The other 3 categories are important pillars that support these activities (SPORT & CONTENT/GROWTH) or influence them (SOCIAL CONNECTIONS).
*NOTE: What is important to acknowledge is that the activities important to be exposed in the observational template are those that occur after a person’s working hours /job.
A job occupy on average from 8 to 10 hours a day. What a person is doing in those hours has of course a very important impact on their development. The job description however is for most people a stable factor that doesn’t change on a daily basis. It’s a long term decision they made.
The study is meant to focus on the after-work activities that change on a daily basis and how they impact our lives. Which ones help us develop, affect our mood (in a positive or negative way) or waste our time?
Examples of notable activities: Any activity that filled in a person’s time on the side of their job.
- Having dinner with friends
- Joining a specific training
- Joining a specific event
- Certain places visited
- Vacations
- Hobbies: Reading, clubbing, bowling, sports & co.
- Traveling
- Etc.
B) SOCIAL CONNECTIONS:
Social connections are about the people that a person meets throughout the ACTIVITIES they participate in or the friends that are around them in those circumstances.
Examples:
- Friends
- Parents
- Colleagues
- Partners
- Aquitances
- Spouses
- Menthors
- Therapists
- Etc.
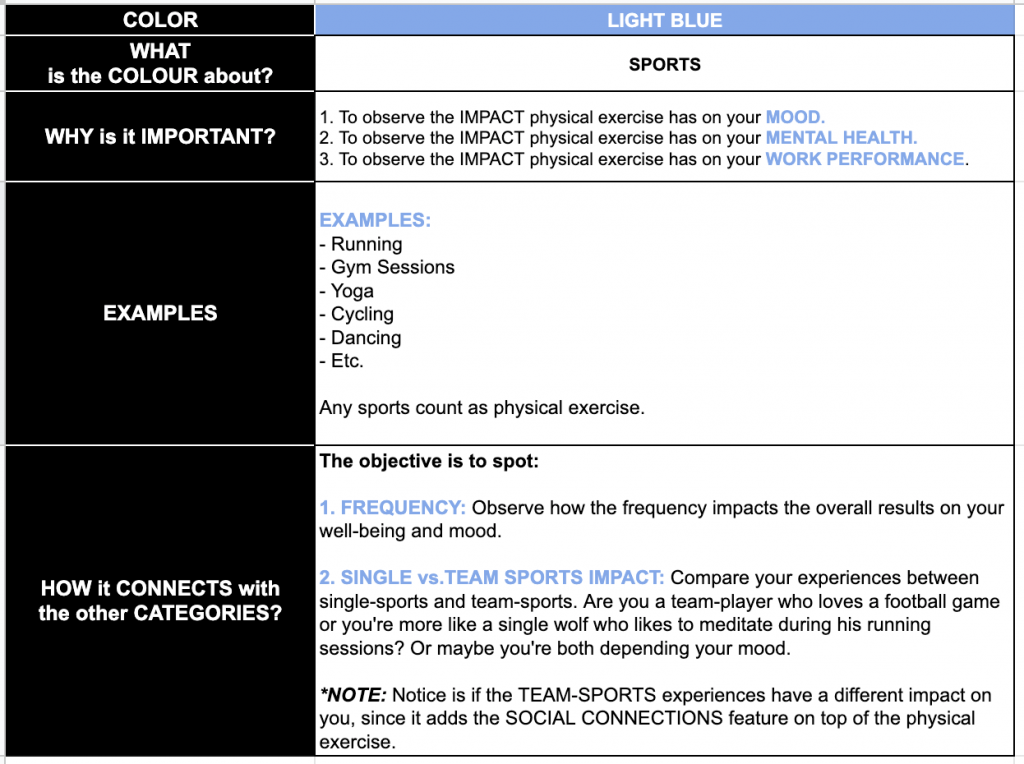
C) SPORT:
When it comes to physical exercise what is important to observe is its frequency on a person’s agenda and weather it provides social connections or not (depending on its type: team-sport or single-sport).
D) CONTENT/ GROWTH:
Any activity or piece of content that brings on the table new academical learnings, enrich a person’s knowledge or have any feature of personal development attached to it.
Examples:
- Trainings & Workshops
- Books
- Documentaries
- Conferences & Events
- Business Masteries
- Coaching or Therapy Sessions
- Etc.
*NOTE: If an ACTIVITY has a CONTENT/GROWTH feature, it will be listed in both sections: ACTIVITIES and CONTENT/GROWTH. We are doing so because each of them will be marked with a different color according to the color pattern and will provide a different value depending on that. More explanations related to the method will be presented below.
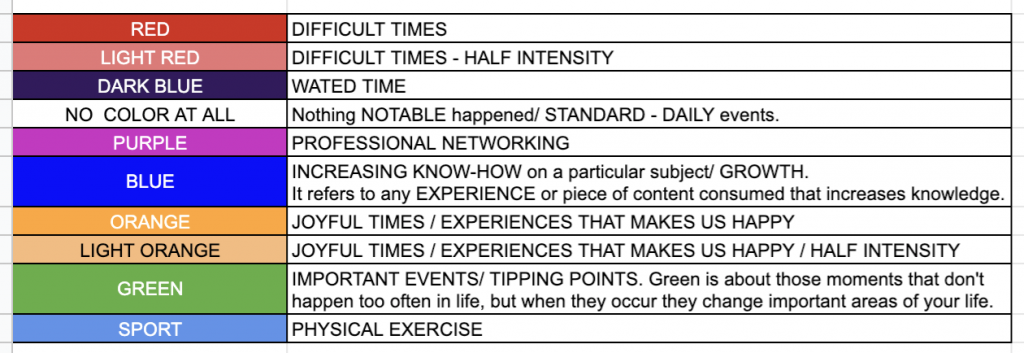
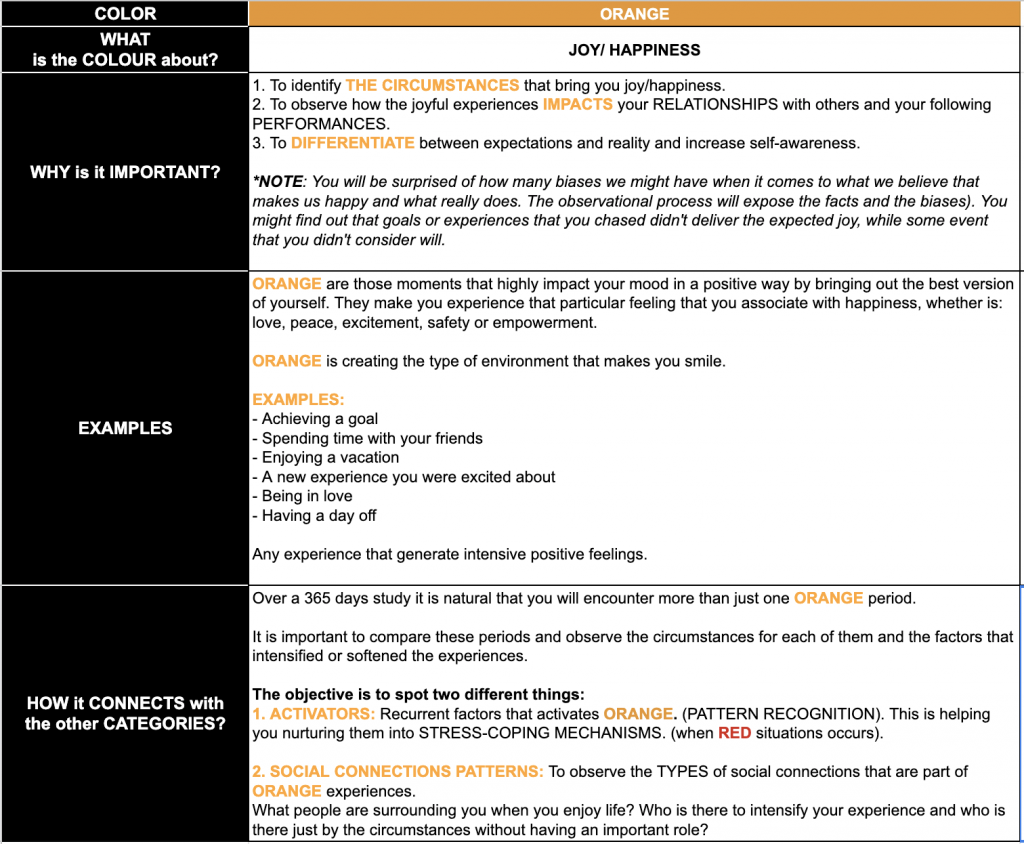
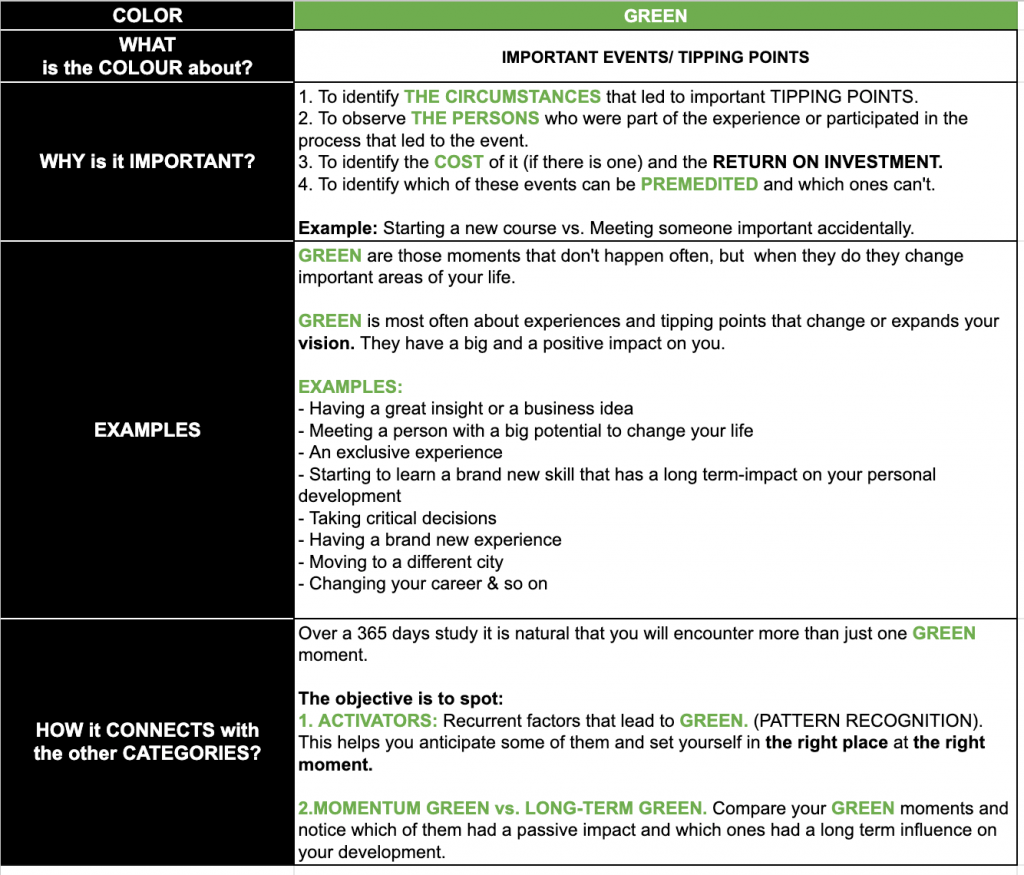
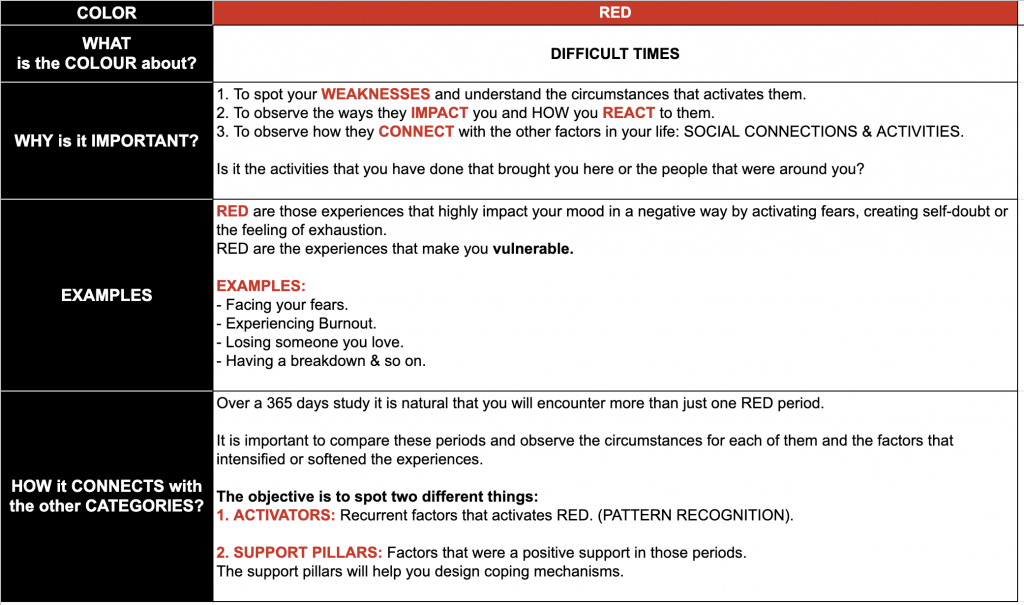
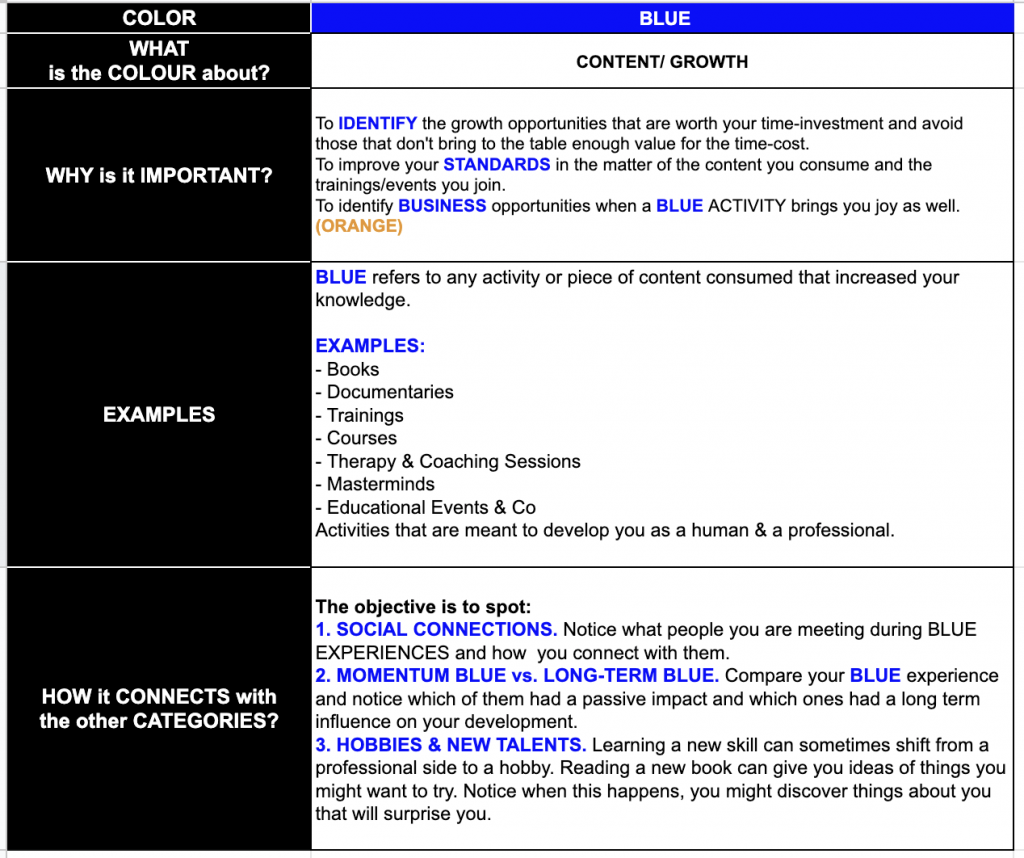
3. COLOR PATTERN:
What is it and what is its role?
RED, ORANGE, SHADES OF BLUE, GREEN & PURPLE
A) WHAT IS IT ACTUALLY?
The COLOR PATTERN is a method that facilitates an easier way to spot important links and opportunities on a person’s template through a visual way.
B) WHAT IS THE ROLE OF THE METHOD AND ITS USE?
- It exposes the cause-effect relationships related to the subject’s daily activities:
- What are the activities that really impact the subject’s mood in a positive way?
- What are the activities that really impact the subject’s mood in a negative way?
- What are the activities that help the subject to develop?
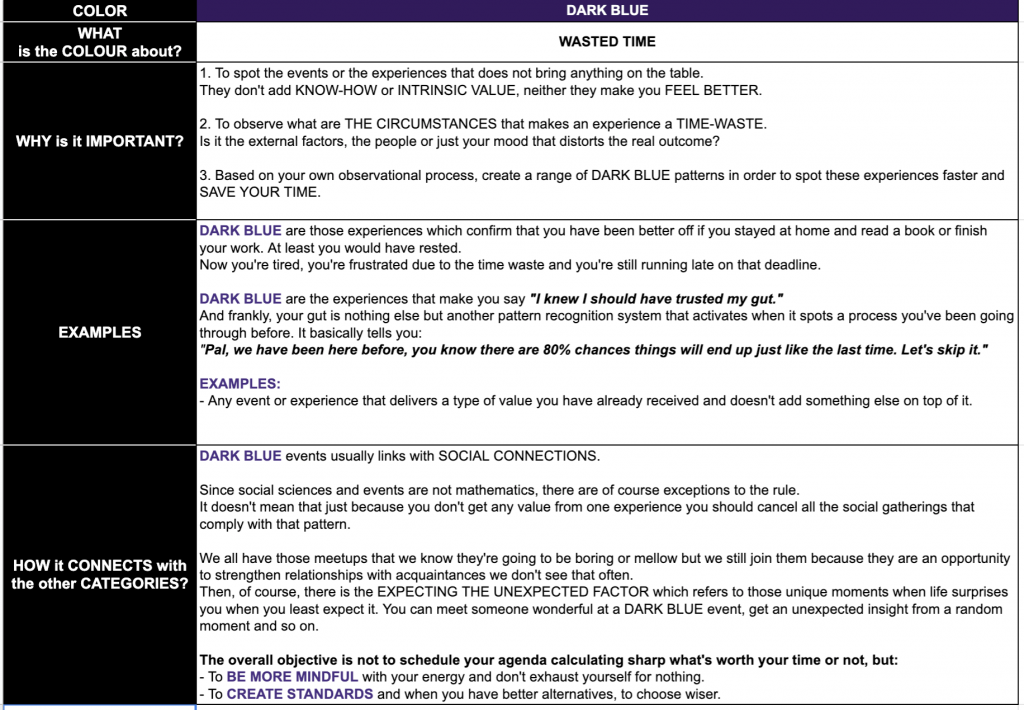
- What are the activities that are time-wasters?
- How are particular relationships influencing the subject’s activities, performances and moods?
- Another role of the COLOR PATTERN is that it helps finding opportunities to meaningful relationships building.
Example: joining a certain SOCIAL CLUB might bring you the opportunity of meeting wonderful people, despite the fact that you had different assumptions on the matter. The events can happen the other way around also: joining a certain SOCIAL CLUB might prove to be a waste of time, despite your expectations on the matter.
The color pattern is meant to expose the biases we have and discover new opportunities we didn’t think of.
C) WHAT IS THE MAIN RULE TO PROPER USE IT?
For the pattern to work is very important that you are honest with how you fill in the colors on your template. Sometimes, the activities you thought will bring you joy might not raise up to your expectations. Be honest with yourself when such situations occur and fill in the template accordingly.
Remember that this is something you are doing to get a deeper understanding on what you need and what works for you. The best results reveal by collecting authentic data.
Karl Marx wrote his Phd. thesis on Epicurus’ philosophy on excess spending that supports the belief according to which“The more you know what you really need, the less you desire.”
The pattern is meant to help you learn what you really need.
4. Understanding the COLORS and their LINKS with the CATEGORIES.
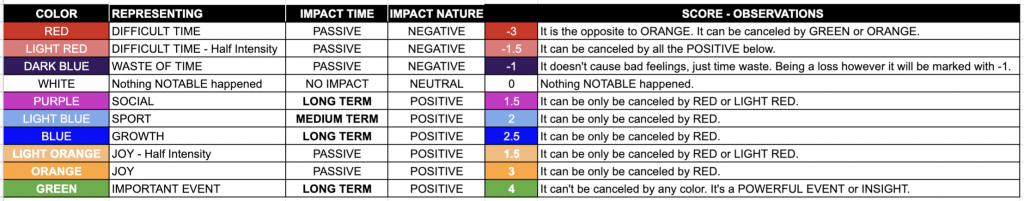
THE VALUE CRITERIA USE FOR DATA EVALUATION IN PART III (Data Analysis). The value criteria is needed to understand some of the NOTES you will find below in the color presentation.
PART III: Data Analysis
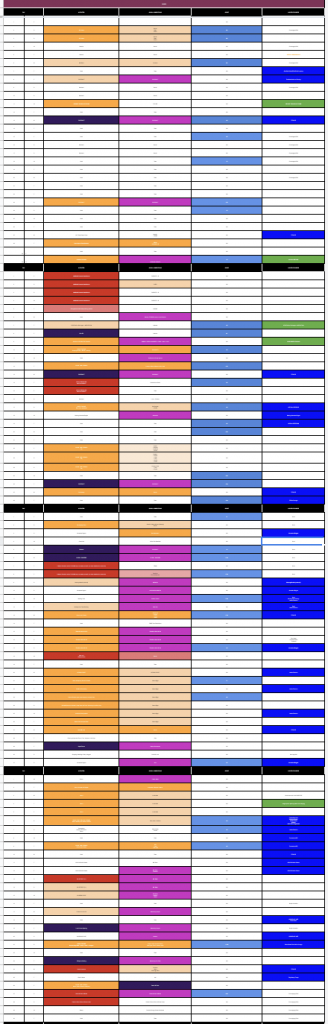
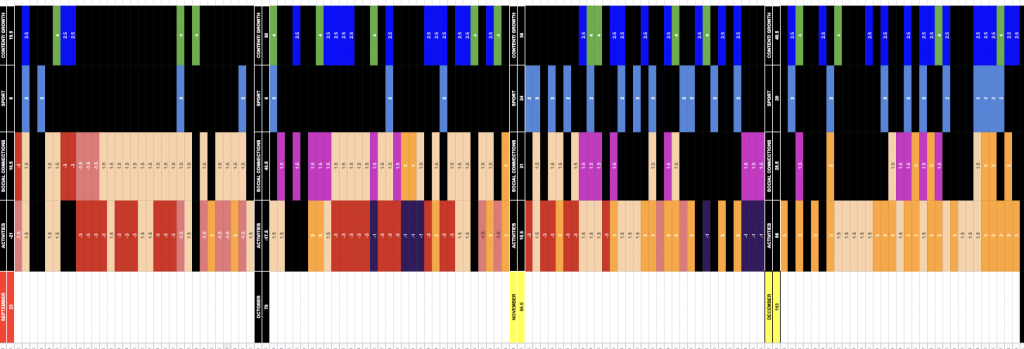
1. Presenting the Original Template
Below is the original template with the data collected in the 365 days of year 2019.
*For privacy reasons the text-content is not readable, but the conclusions will be presented below.
![]()
2. Value Criteria & Data Interpretation
STEP 1: Eliminate the blank space events from the template to highlight the color pattern.
STEP 2: Replace Descriptive Data with the Value it represents. (The ACTIVITIES’ details, names of SOCIAL CONNECTIONS and details about CONTENT/GROWTH and SPORTS).
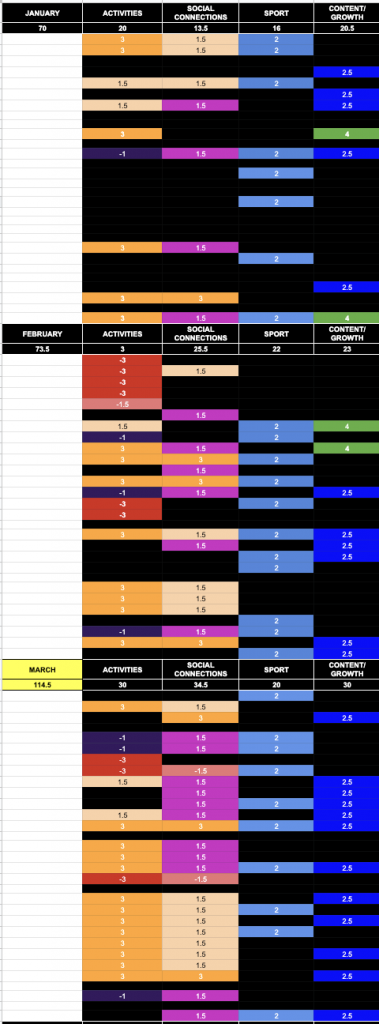
![]()
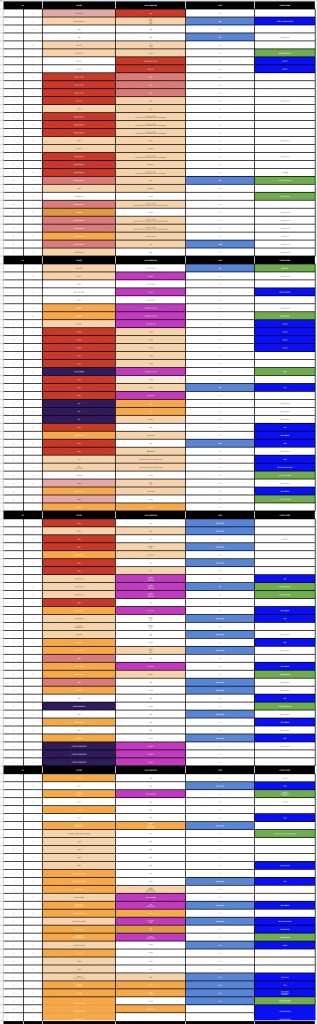
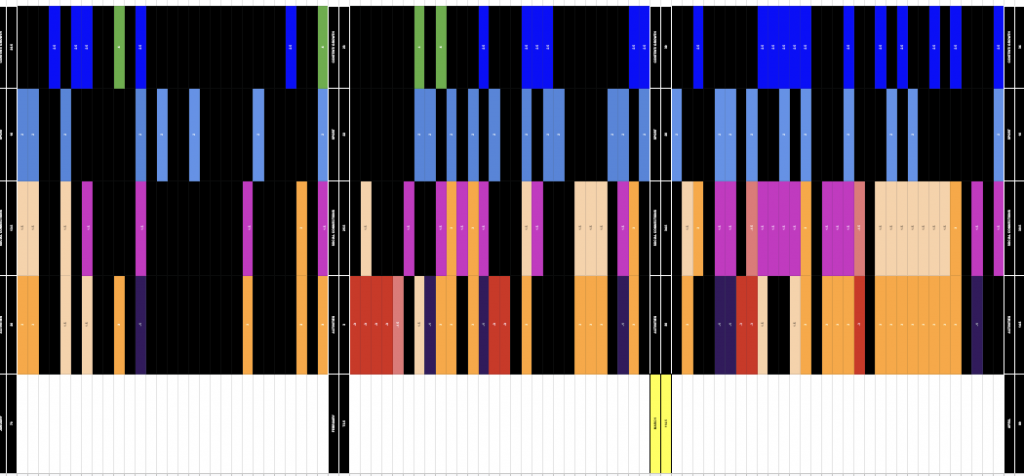
STEP 3: Shrink the monthly data and highlight the values that scored above or below average.
RED = Way below the average score.
YELLOW: Way above the average score.
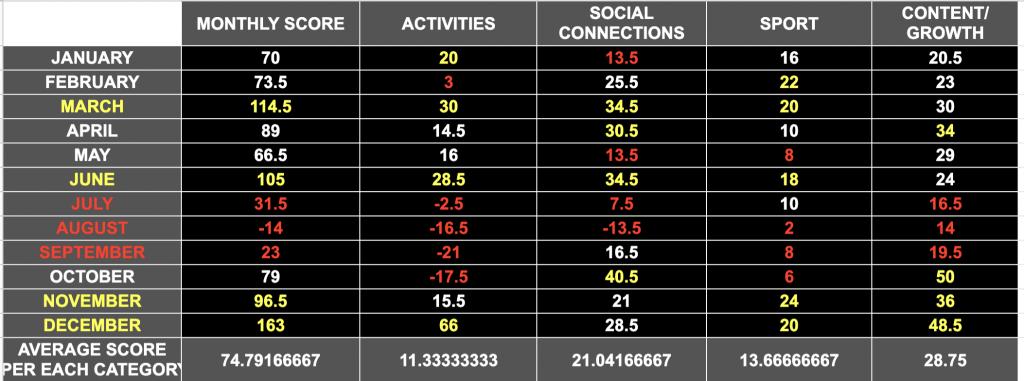
We can observe that MARCH, JUNE, NOVEMBER and DECEMBER scored the highest levels while JULY, AUGUST and SEPTEMBER presented the lowest scores.
GOOD MONTHS INSIGHTS:
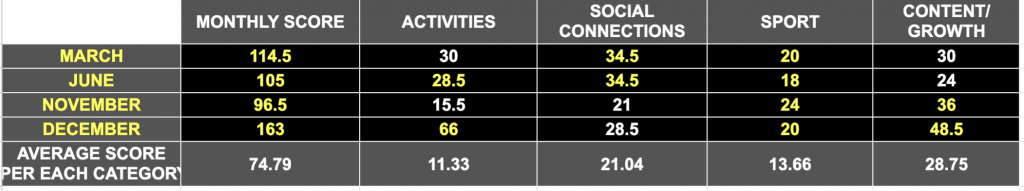
- All months: We can observe that the FACTOR that presents values above average for all of them is the SPORT section.
- December presents a very high value on the ACTIVITIES section, which highlights great scores on the affective value (JOY/ORANGE). This aspect can also be reviewd in the monthly color pattern above. It presents a 66 score compared to the average of 11.33.
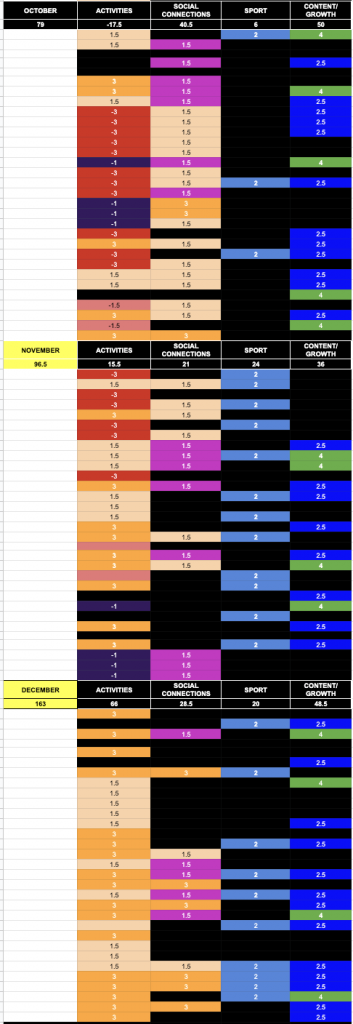
- December also presents a great value on the section for CONTENT/ GROWTH experiences (BLUE & GREEN). It presents a 48.5 score compared to the average of 28.5.
- November follows December on the CONTENT/ GROWTH experiences with a 36 score, compared to the average of 28.5.
- March & June present great scores on SOCIAL CONNECTIONS. We have a 34.5 for both of them compared to the average of 21.04.
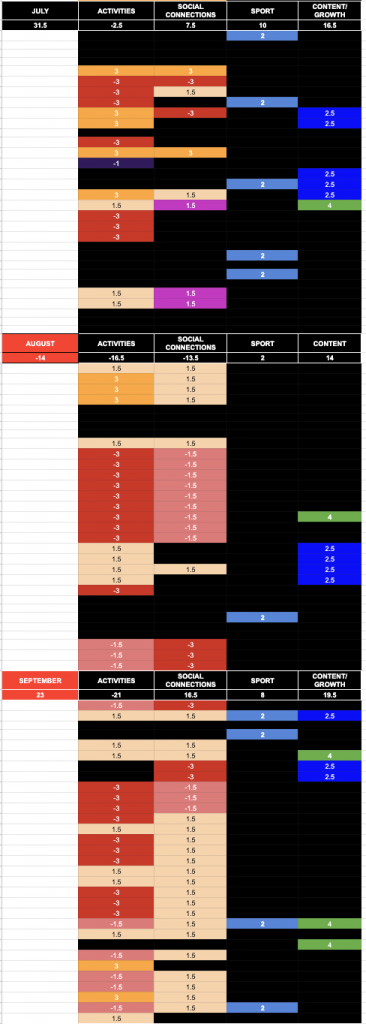
DIFFICULT MONTHS INSIGHTS:
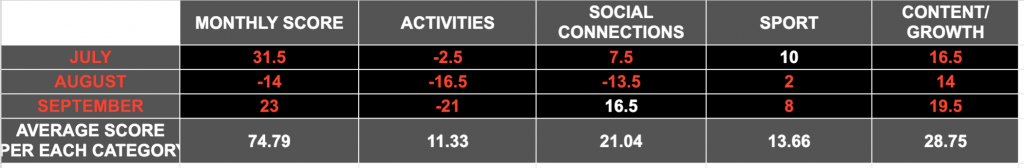
- July scores the highest monthly value (31.5) and what we observe is that it is also the only month that presents a resonable score in the SPORT section (10).
- September follows July on the matter of SPORTS with a score of 8.
- September also presents by comparison the lowest score on ACTIVITIES, related with the affective values (ORANGE/ RED), but it compensates on the SOCIAL CONNECTIONS – where it scores the highest value out of these 3 months.
- August presents the lowest score spotted in the SPORTS section, not just by comparison with these 3 month, but with the entire year.
- August also follows September on the ACTIVITIES with a -16.5 score, compared with the average of 11.33. When it comes to SOCIAL CONNECTIONS we spot as well low values of -16.5, compared to the average of 21.04.
OTHER INSIGHTS AND OBSERVATIONS ON SCORES
- High scores on ACTIVITIES: December, June, March, January
- Low scores on ACTIVITIES: September, October, August, July
- High scores on SOCIAL CONNECTIONS: October, June, March, April
- Low scores on SOCIAL CONNECTIONS: August, July, January, May
- High score on SPORT: November, February, December, March
- Low scores on SPORT: August, October, September, May
- High scores on CONTECT/GROWTH: October, December, November, April
- Low scores on CONTENT/GROWTH: August, July, September, January
OTHER INSIGHTS AND OVERVATIONS ON THE COLOR PATTERN
September October November December
- We observe a shift in the ACTIVITIES section (Affective value) from RED shades to ORANGE that changes simultaneous with the increase of SPORT (LIGHT BLUE) frequency and GROWTH experiences. (GREEN & BLUE)
- We observe that the low score in the ACTIVITY section in September and October are compensated by good values in the SOCIAL CONNECTIONS section. (the one that is below sports/light blue).
May June July August
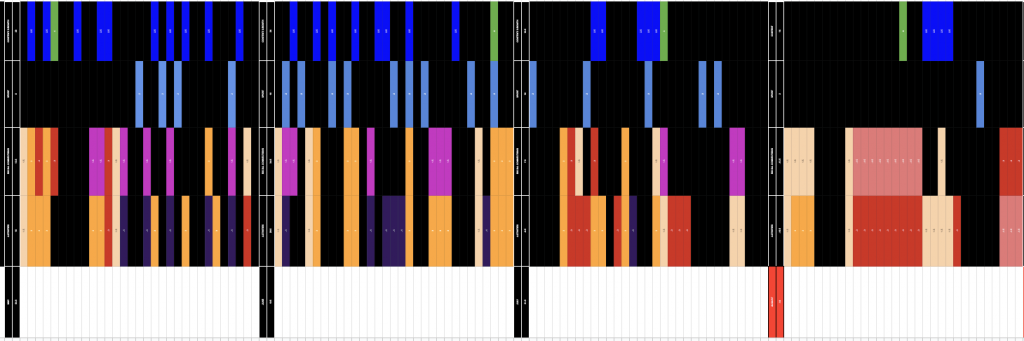
- We observe a decrease of value the CONTENT/GROWTH SECTIONS (BLUE & GREEN) and SPORT one (LIGHT BLUE). We can see that the decrease starts in the last week of June, it’s continuing in July and leads to almost no activity in these sections in August. This seems to lead to a RED period (difficult time) in August.
- We can also observe that we don’t spot too many joyful events (ORANGE) to support the decrease of the other sections, which could also be a factor that led to the RED period.
- The same pattern can be noticed in:
January February March
- January – Low values in SPORT (LIGHT-BLUE)
- January – Low values in joyful events (ORANGE)
- January – Low values in SOCIAL CONNECTIONS (PURPLE & ORANGE below SPORTS.)
- Resulted in a RED period at the beginning of February.
- We can observe also that the RED period passes and the mood starts to transition from RED to ORANGE as soon as the activity in the other sections increase (SPORT + CONTENT/GROWTH + SOCIAL CONNECTIONS).
3. Conclusions and Personal Thoughts
The beauty of the study doesn’t rely just on the fact that it reveals in chunks how specific areas of our lives are impacting our mood, performance and the relationships we have, but it also offers a granular view on the specific events and details that participate in these processes.
Its value is compounded by both: the fact that it’s a standard tool that can be used by anyone, and also the fact that the results will be different for each person that uses it.
Another aspect we should remember is that the tool exposes 3 important parts:
- The detailed processes we participate in;
- The affective value of them and
- The impact they have on us: short to medium and long term.
MEDITATION and NUTRITION might be also important factors to impact these process. However, I didn’t consider them from the beginning. They can be potential variables to be included in a further version of it.
For now, I am pretty contented with the overall results and I am looking forward to polishing it for a final version and some fine adjustments. The end objective would be to take it forward to a product level.
Wish you all an amazing 2020 filled with JOY, GROWTH and lots of meaningful SOCIAL CONNECTIONS!
Andrada,
Special thanks go to the people that literally colored the most important moments of my year in 2019. Thank you all for being a part of it!
- My parents
- My sister
- Cristiana Andrei
- Ruxandra Ion
- Andreea Dora Cobzaru
- Marin Elena
- Daniel Georgescu
- Florin Leuca
- Avi Cicirean
- Diana Cicirean
- Monica Pertea
- Sara Elsheikh
- Bogdan Anghelina
- Emilia Haiduc
- Ramona Emanuela Mindru
- Vikram Jotwani
- Randi Zuckerberg
- Maria Obretin
- Serban Pitic
- Carmen Bobu
- My Rotaract Club Friends
- Raluca Kisescu
- Amalia Pascalau
- Ion CIobanu
- Dan Radulescu
- Irina Ursuletu
- Deian Nicolici
- Florentina Petrisor
- Sorin Apavaloae
- Iulia Uta
- Alexandra Stanciu
- Diana Cobzaru
- Bogdan Haituc
- Mihai Ciubotariu
- Mihai Marin
- Alex Secareanu
- Lucian Geana
- Teodora Baltatu
- Ioana Dinu
- Mihai Putinelu
- Andrei Langa
- Robert Voicu
- Silvia Marinescu
- Alex Rada
- Tim Fidgeon
- Tim Howes
- Sonia Nechifor
- Peter Gartland
- Goldie Chan
- Silviu Cobzaru
- Andreea Bocaneala
- My Global Shapers Hub Colleagues
- My Aspire Friends
- My Acting Colleagues
- My Debate Classes Colleagues
- Ana Grigorescu
- Sergiu Manea
- Ron Kaufman
- Kjell Nordstrom
- Jeffrey Rogers
- Alexandre Werkoff
- Stan Cristian
- Adriana Istrate
- Shed Simove
- Daniel Stanciu
- Cosmin Marin
- Larisa Puscasu
- Razvan Furdui
- Sabina Blendea
- Ana Costea
- Cami Costea
- Oleg Blajin
- Rares
- Daria Benghea Malaies
- Lucian Francu
- Horia Benga
- Alin Apostu
- Simon Angel
- Raluca Munteanu
- Elena Stanica
- Catalin Oltean
- Adelina Petruta
- Andrei Petruta
- Madalin Preda
- Alexandra Bogatu
- Bogdan Pavel
- Sorana Pascariu
- Vlad Nutu
- Adelina Maria
- Maria Marin
- Zena Chiloflishci
- Sorin
- George Coltea
- Andreea Spirache
- Axel
- Roberta
- Diana Elizabeth
- Radu Vladimir
- Dan Oros
- Elena Kuji
- Alexandra Badita
- Vali Barbulescu
- Teodora Iojiban
- Georgiana Nastase
- Sam Potolicchio
- Alexa Chiorean
- Adrian Posteuca